Tip or Skip: NYC Taxi Tipping Prediction & Dynamics
A comprehensive exploration of spatiotemporal dynamics behind taxi tips, evaluating machine learning models from gradient boosting to deep learning MDNs.
Motivation and Background:
According to data on Indeed.com, taxi drivers earn around $25 per hour or around $52,000 per year. This figure was chosen as a solid middle ground; most of the other estimates given by other sources were lower, and some were a bit higher. Moreover, given the extremely high costs of New York City, drivers can work up to 60 hours a week. However, it is difficult to pin down their actual net income compared to their gross income. This is because most drivers also bear the costs of work, such as gas, vehicle leasing, and more. As a result, tipping has far more implications for a taxi driver's income than their hourly wage.
Naturally, drivers with more experience in higher-demand areas earn the most. However, this can create a "top-heavy" industry where older, experienced drivers pick up most of the work and thus the tips. This can disadvantage newer, younger drivers who are more prone to mistakes and might receive fewer tips. According to a dataset, 44.3% of taxi drivers are over 50 years old, whereas 8.5% of drivers are younger than 30. In comparison, about 24.5% of Uber drivers are over 50 years old, and 19.9% are younger than 30. Many other industries have this problem, especially in urban areas, where most of the work goes to already experienced workers.
Introduction:
A map predicting tipping rates and amounts may not be the perfect solution to some of these problems, but it could potentially help. It can be better thought of as an easily accessible supplement to some existing solutions
It is well known that drivers focus on working in high-traffic areas during peak hours, especially in Manhattan or airports, where wages and tip rates are far higher. What is not well known is that drivers bear the cost of gas, and thus, simply maximizing the number of trips in the city is a poor strategy. Sitting in traffic for a long time is an inefficient use of fuel and lease time. By using our map, drivers can identify zones where high tip rates make each trip worth the fuel and time invested, rather than chasing volume alone.
Furthermore, a tip map tool accessible to everyone means a reduced learning curve and thus improved competition. Younger drivers can compete against veteran drivers with access to the same locational and time-based advantages, this time with a more data-centric approach. Instead of spending months figuring out how to navigate the city and optimize their wages, they can do initial research using our tool.
Data:
We used metered ride records from the NYC Taxi and Limousine Commission public dataset. Our data consists of 24 total months of records from 2024-2025, specifically 12 months of yellow taxi records and 12 months of green taxi records. After cleaning, this comes out to about 420,000 trips.
The dataset contains many details for each trip, including but not limited to pickup and dropoff zones, timestamps, trip distance, and fare amount. Only tips paid through credit card transactions are included. Unfortunately, this means our sample is fully limited to customers using credit cards for tips, but we do not believe this will affect our general conclusions.
For the model, we used the months January to September as our training set, October as our validation set, and the last two months as our test set.
Implementation
We have a deployed Gradio app with a reusable artifact pipeline, so
the project is a working system rather than only a notebook. The
runtime app is app.py. It builds the Hugging Face Space
interface, loads the saved artifacts, and connects each user input to
the same model files and summary tables used in the report. The data
processing and original runtime model utilities are handled by
pipeline.py, while the final dataset loader, feature
encoders, baseline models, Transformer-MDN, experiment code, graph
model, sequence model, and driver-copilot helpers live in
src/tip_or_skip/ and scripts/. The app does
not retrain models during deployment. Instead, it loads precomputed
outputs from artifacts/, including the final boosted tree
hurdle model, Transformer-MDN files, report tables, zone risk tables,
calibration bins, ablation results, sequence metrics, graph metrics,
Transformer ablation results, and driver LLM evaluation files.
The app is organized around the main ways someone would inspect the project. The prediction view lets a user define a ride by taxi type, pickup and dropoff zone, pickup time, fare, distance, duration, vendor information, passenger count bucket, rate code, and store-and-forward flag. It then returns the probability of a recorded electronic tip, the predicted tip amount if a tip happens, and the expected tip value for that ride. The Model Lab compares the final models and includes a same-ride check, where the boosted tree hurdle model and the Transformer-MDN are run on identical ride inputs. This matters because the comparison is about the models, not about two different example rides. The Experiment Lab shows the supporting work behind the final system, including feature ablations, probability calibration, hourly sequence forecasting, graph-zone experiments, and driver-copilot checks. The map and shift planner translate zone-level model outputs into a driver-facing view, so a taxi driver can compare pickup areas by expected tip, downside risk, and observed volume. Ask The Data and Driver Copilot answer grounded questions from the saved metrics, zone risk tables, and model outputs, so the natural-language parts of the app explain project evidence rather than inventing new results.
Methods
Our main prediction task is a two-stage hurdle problem because tipping
has two parts. First, the model needs to estimate whether a ride gets
a recorded electronic tip. Second, if the ride is likely to get a tip,
the model needs to estimate how large that tip may be. In notation,
the first stage is P(tip_given = 1 | x) = f_class(x),
the second stage is
E(tip_amount | tip_given = 1, x) = f_amount(x), and the
final expected value is
E(tip_amount | x) = P(tip_given = 1 | x) * E(tip_amount | tip_given
            = 1, x)
. This final value is what the app compares across rides and zones.
We started with a linear hurdle baseline. It uses logistic regression
for tip_given and ridge regression for positive
log_tip_amount, giving us a simple reference point that
is easier to interpret. We then trained a histogram gradient boosting
hurdle model because the data mixes numeric variables, categorical
zone information, fares, distances, time features, taxi type, and
service-zone details. The boosted tree became the main point
prediction model because it handled those nonlinear interactions best.
In the final comparison, it had the lowest expected-tip MAE at about
$1.45 and a ROC-AUC of about 0.771 for the tip/no-tip stage.
We also trained a tabular Transformer with a Mixture Density Network
head. This model treats trip features as learned inputs and predicts a
distribution over positive tip amounts instead of only a single
average. The distribution is
p(tip_amount | tip_given = 1, x) = sum_k pi_k(x) * Normal(mu_k(x),
            sigma_k(x))
, and its expected-tip form is
E_MDN(tip_amount | x) = P(tip_given = 1 | x) * sum_k pi_k(x) *
            exp(mu_k(x) + 0.5 * sigma_k(x)^2)
. The Transformer-MDN was not the strongest point predictor, with
expected-tip MAE around $2.34, but it is useful because it gives a
range of possible positive tip amounts for the same ride. That matters
when a driver cares about downside risk, not just the average.
We also ran feature ablations for the Transformer-MDN. For this test, we trained a new Transformer for each feature group. We did not remove columns from the saved full Transformer because that would change the input shape. The full model had expected-tip MAE around $2.37. Removing distance features hurt the most, with MAE around $2.50. The other feature removals stayed close to the full model. This means the Transformer was most sensitive to distance in this run.
We also tested whether the project could go beyond scoring one ride at a time. The sequence LSTM converts recent hourly summaries into a short time series and predicts the next period's tip rate and average tip. This tests whether recent movement contains useful shift-level information. For example, a zone can look strong on average but be cooling down during the current shift, while another zone can be improving. The LSTM improved average-tip forecasting compared with a naive baseline, with average-tip MAE around $1.78 compared with about $2.40 for the naive forecast, while the tip-rate improvement was smaller.
The graph model treats taxi zones as connected nodes. Edges come from observed pickup-to-dropoff flows, so two zones become related when riders frequently travel between them. This tests whether tipping behavior is partly explained by the structure of the city and the flow of trips between zones. The graph experiment was useful as a diagnostic, but it was not the strongest predictor. Its zone-tip MAE was about $1.21, while the simple temporal baseline was about $0.41, so the graph result shows that ride flow alone is not enough to replace the final boosted tree or the zone-risk summaries.
The driver LLM experiment tests the communication layer. It uses grounded examples built from model outputs and zone risk tables, then fine tunes a small instruction model to produce driver-facing advice. The goal is not to make the language model invent new predictions. The goal is to see whether model evidence can be translated into a clear recommendation with numbers, zone names, and caveats that a driver can actually use.
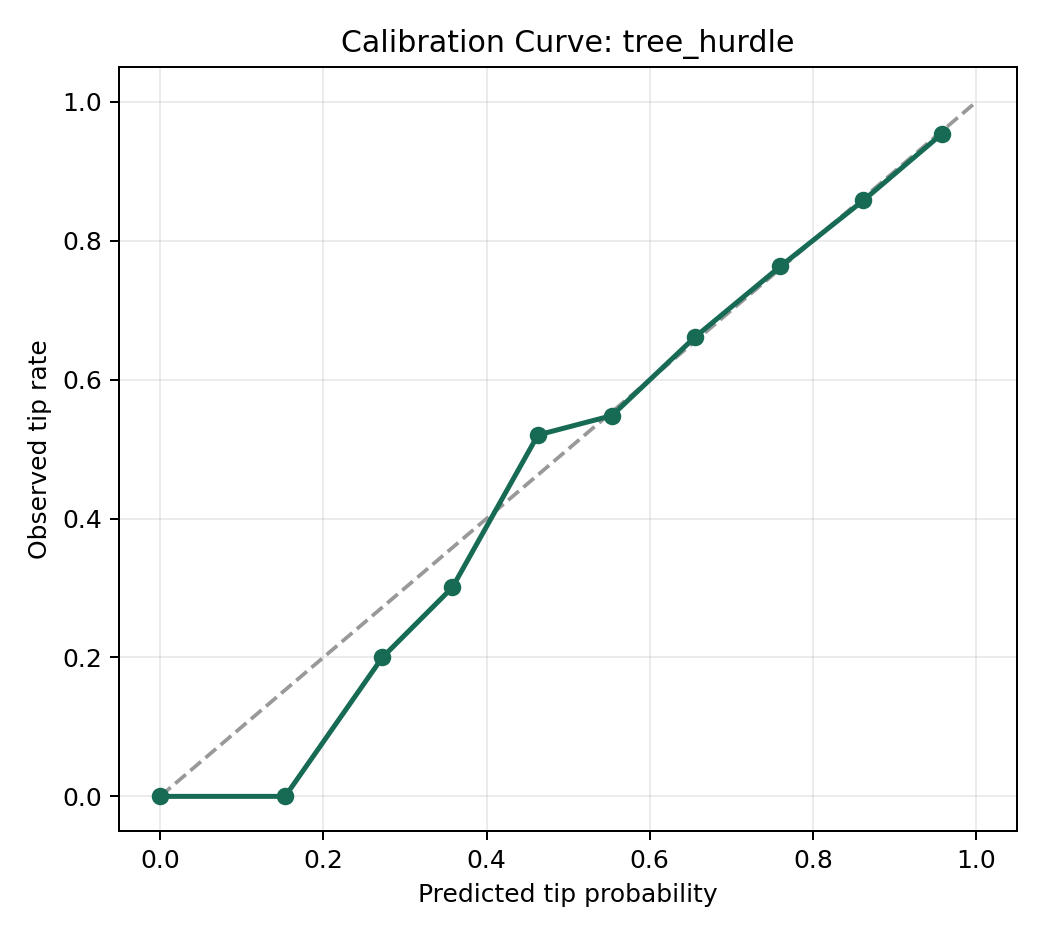
Our tip/no tip stage evaluation relied on ROC-AUC, average precision, log loss, Brier score, and calibration error because the classification stage has to do more than separate likely tippers from unlikely tippers. ROC-AUC measures ranking quality, average precision checks performance when the positive class is the focus, log loss penalizes overconfident wrong probabilities, and Brier score and calibration error show whether the predicted probabilities behave like real probabilities. For the positive tip amount stage, we used MAE and RMSE because the model also needs to estimate how large the tip may be when a tip happens. MAE gives the typical dollar error, while RMSE makes larger misses more visible. Expected tip MAE then evaluates the final value that a driver would actually compare across rides, since expected tip combines both the chance of getting a tip and the predicted amount. Calibration and ablations are included because a practical planning tool needs trustworthy probabilities and understandable feature behavior, not only a low average error. If a driver is choosing between zones or deciding whether a ride is worth prioritizing, the app should make clear which signals are driving the recommendation, how reliable the probability estimates are, and where the model is weaker.
Result
In the process of building the Tip or Skip system, we not only focus on the final prediction accuracy, but also hope to deeply understand the spatiotemporal dynamics behind taxi tips. After applying multiple models to the dataset, we compared their performance and actual performance. The following are the core findings we have derived from our experiments.
Data analyse
Before delving into complex machine learning models, we first analyzed the macro trends.
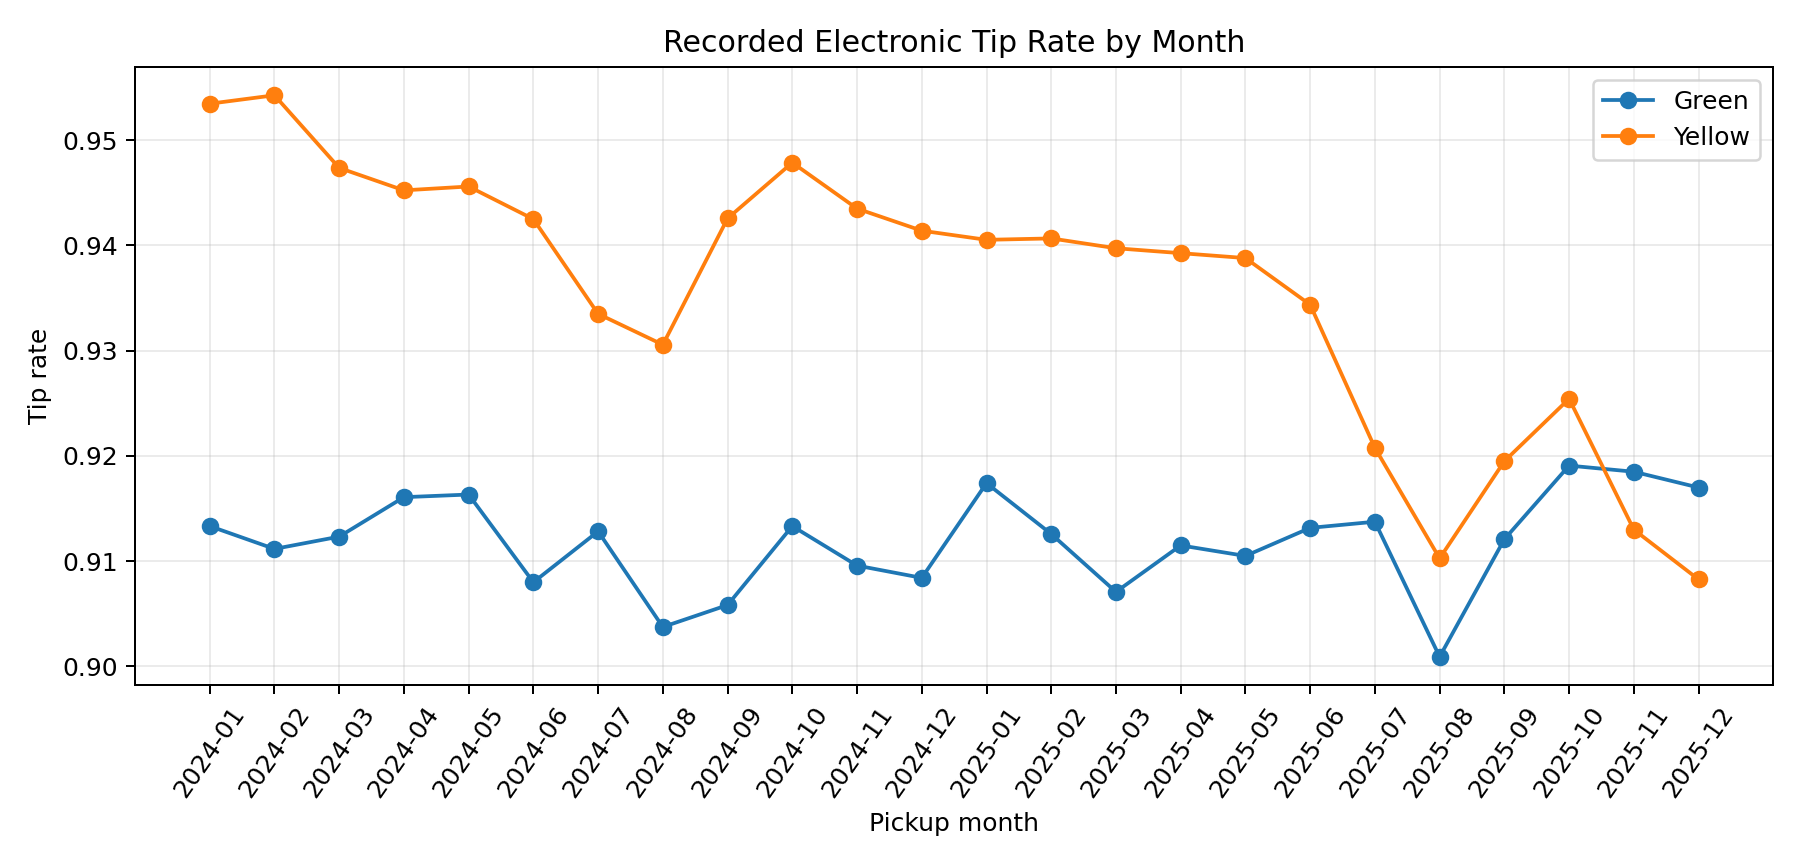
The monthly data shows that the tip ratio fluctuates to some extent among different months. The overall tip rate of Yelow type vehicles has been continuously declining, while the tip rate of Green type vehicles, although fluctuating, remains unchanged overall. This indicates that the temporal characteristics are worth analyzing, and our model needs to consider the timing factor. For example, data at the month and year levels.
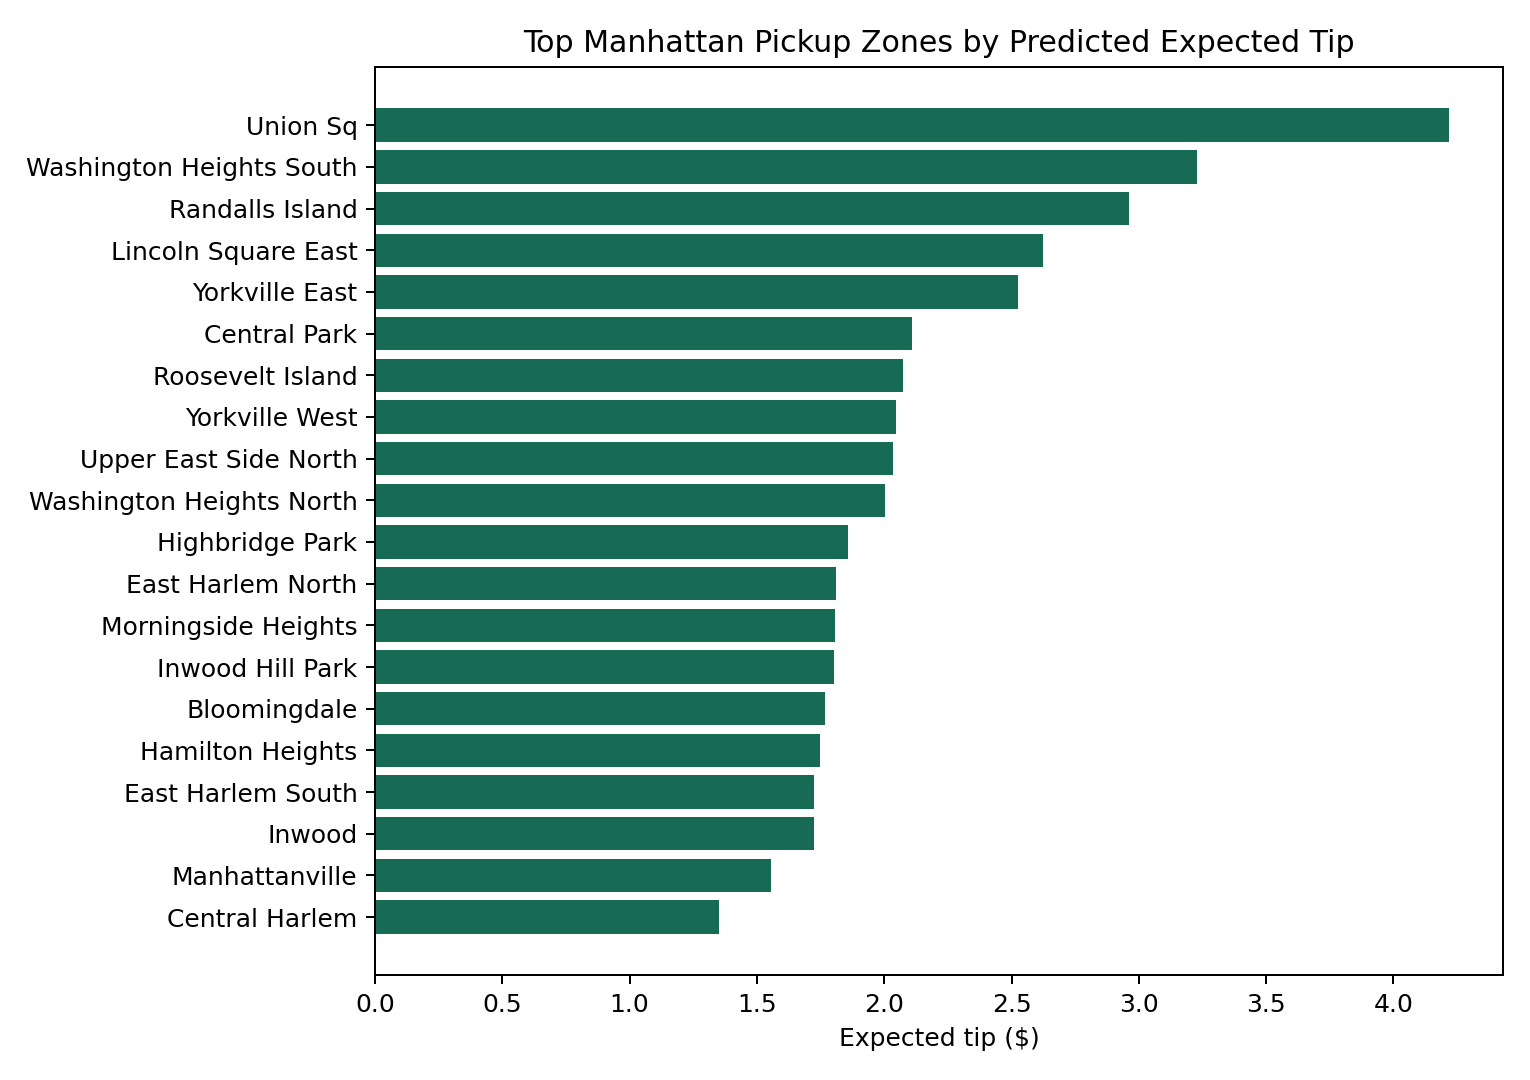
Secondly, there is the spatial dimension. From the perspective of the spatial dimension, there are significant differences in the expected tips for different pick-up and drop-off areas. So, our model also needs to take spatial factors into account. This also echoes our original intention of creating a tip map.
Model selection
After conducting a macro analysis, we clarified from which dimensions our project would start and which ones were important. It's time to choose a model now. In order to find the best prediction scheme, we set problems for Two phase field Model (Two - Stage spend Model) : to predict whether "tipping" (classification), to predict how much to tip "(return)". During the exploration of the entire project, we used the logical/ridge regression baseline, Boosted Trees, and the Transformer-based hybrid density network (Tabular Transformer MDN).
Indicators and results of single-point prediction:
- ROC_AUC: Measures the overall ability of the model to distinguish between positive classes (giving tips) and negative classes (not giving tips). The higher, the better.
- Brier Score: The mean square error between the predicted probability and the true result. It measures both accuracy and calibration. The lower, the better.
- MAE: The difference between the predicted tip amount and the actual tip amount. The lower, the better.
- RMSE: Similar to MAE, but squares the error, penalizing extreme incorrect predictions more severely.
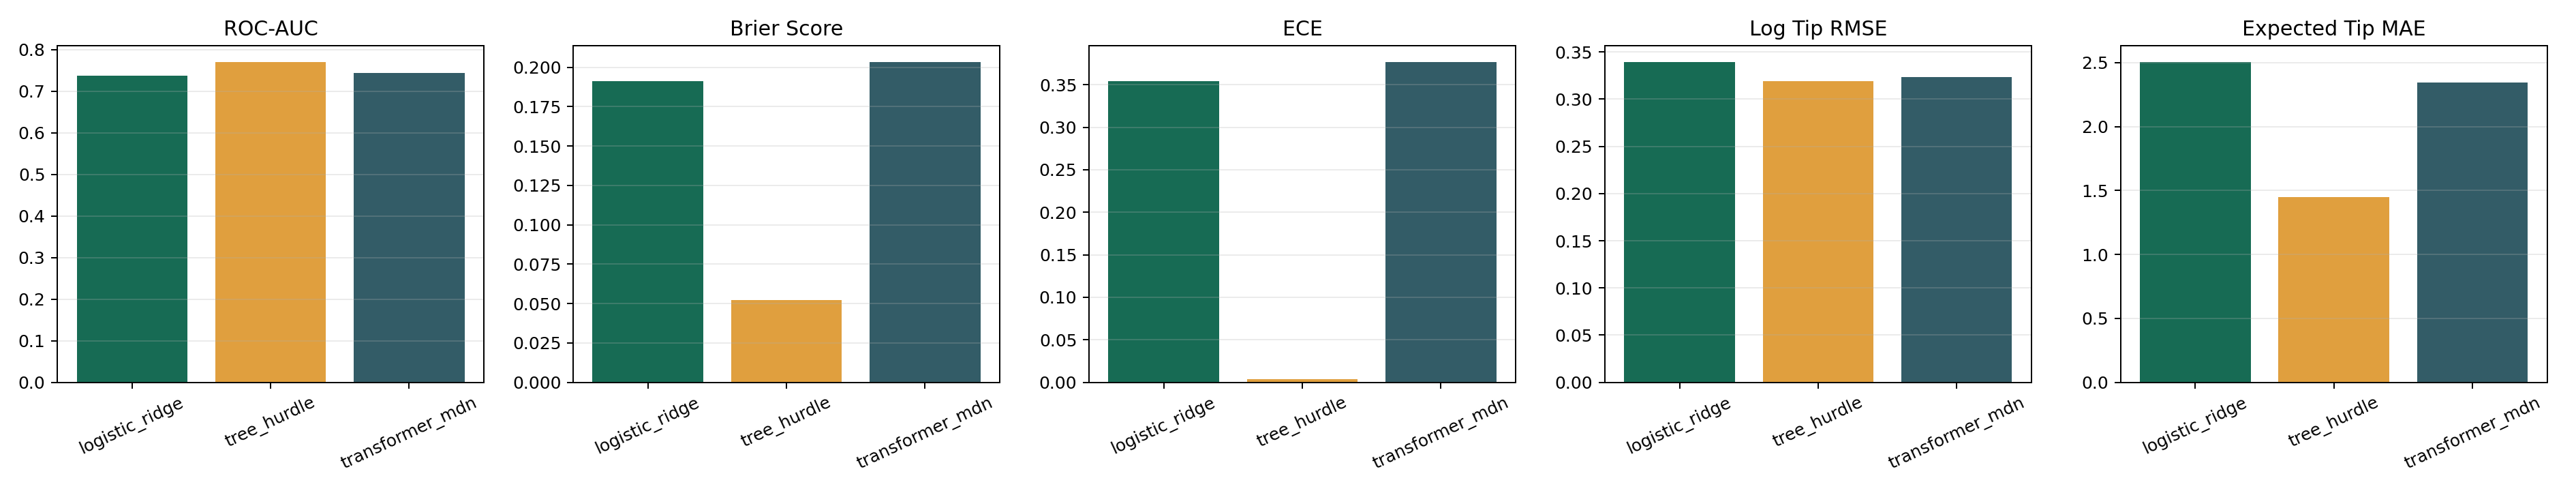
This is a performance comparison of the three models we used. Surprisingly, the gradient boosting tree is the best-performing model. In the classification task of the first stage, it achieved a ROC-AUC of 0.771, and the Brier score was also the lowest. This indicates that when the tree model determines whether passengers "tip or not", it not only has the highest accuracy, but also the output probability is the closest to reality. In the second stage of the regression task, its expected tip MAE (mean absolute error) dropped to approximately $1.45, the lowest among the three models.
The logic/ridge regression model, by contrast, a mediocre. In classification tasks, its AUC is lower than that of the tree model but slightly better than that of the Transformer. In the regression task, its MAE is the highest. This shows that traditional linear models still cannot handle high-dimensional and complex tasks.
Finally Tabular Transformer MDN model and logic/ridge regression model in the classification task performance. It performs slightly better than the logistic/ridge regression model in the regression task, but still not as good as the tree model. Its MAE is as high as 2.3 and RMSE is as high as 3.1. In general, the single point prediction tasks, the performance of the gradient promotion tree is best, in the regression and prediction tasks have reached a very high precision and small errors.
The importance of the Transformer MDN
At this point in the analysis, people have doubts. Since Tabular Transformer MDN is not the best model, then why do we still need it?
This is because all our previous evaluations were single-point prediction evaluations, and this is precisely not the strong suit of Hybrid density networks (MDN). Tabular Transformer MDN can achieve probabilistic Calibration and uncertainty perception. Transformer MDN does not merely output a fixed number but predicts the probability of distribution of tips. This enables our system to provide drivers with confidence intervals, helping them make more reliable shift scheduling decisions.
Ablation Study
After studying the model, we began to study the dimensions and features. Now that we have confirmed the irreplaceability of MDN in "uncertainty perception". We want to confirm that our tree model architecture really works in the research of various features. For instance, whether it has effectively learned the temporal and spatial features in the data. Under this premise, we do the Ablation Study, we try to delete model step by step input features or components, to observe the performance of attenuation. The result is as shown in the following figure:
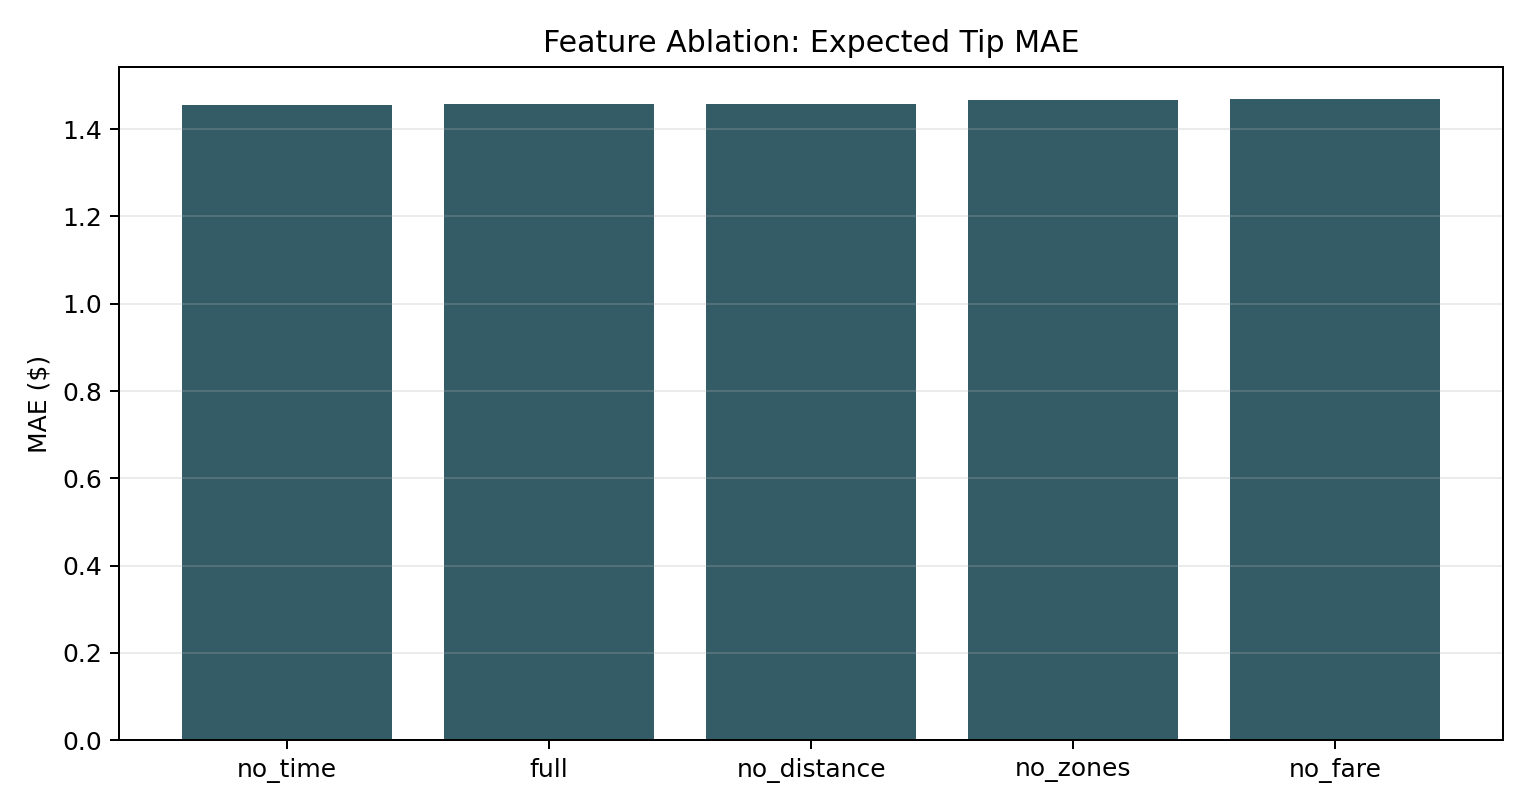
We observed an interesting phenomenon: when some features were removed, the expected tip MAE of the tree model hardly changed. This indicates that removing a single feature has little impact on the model's performance, and our model has strong robustness against non-core signals and will not be disturbed by redundant data. In the future, we can definitely streamline the input features of the model.
Breadth exploration
In the process of seeking the optimal solution, we also attempted some cutting-edge deep learning architectures. Although they did not become the final solutions, they provided some phenomena and results.
GCN
First of all, we want to know what the differences in tips are among various regions in New York and how much they differ from the theoretical values. Because GCN can capture the tip relationship of each region through advantages such as neighbor aggregation and inter-region connectivity, we used GCN to explore this relationship.
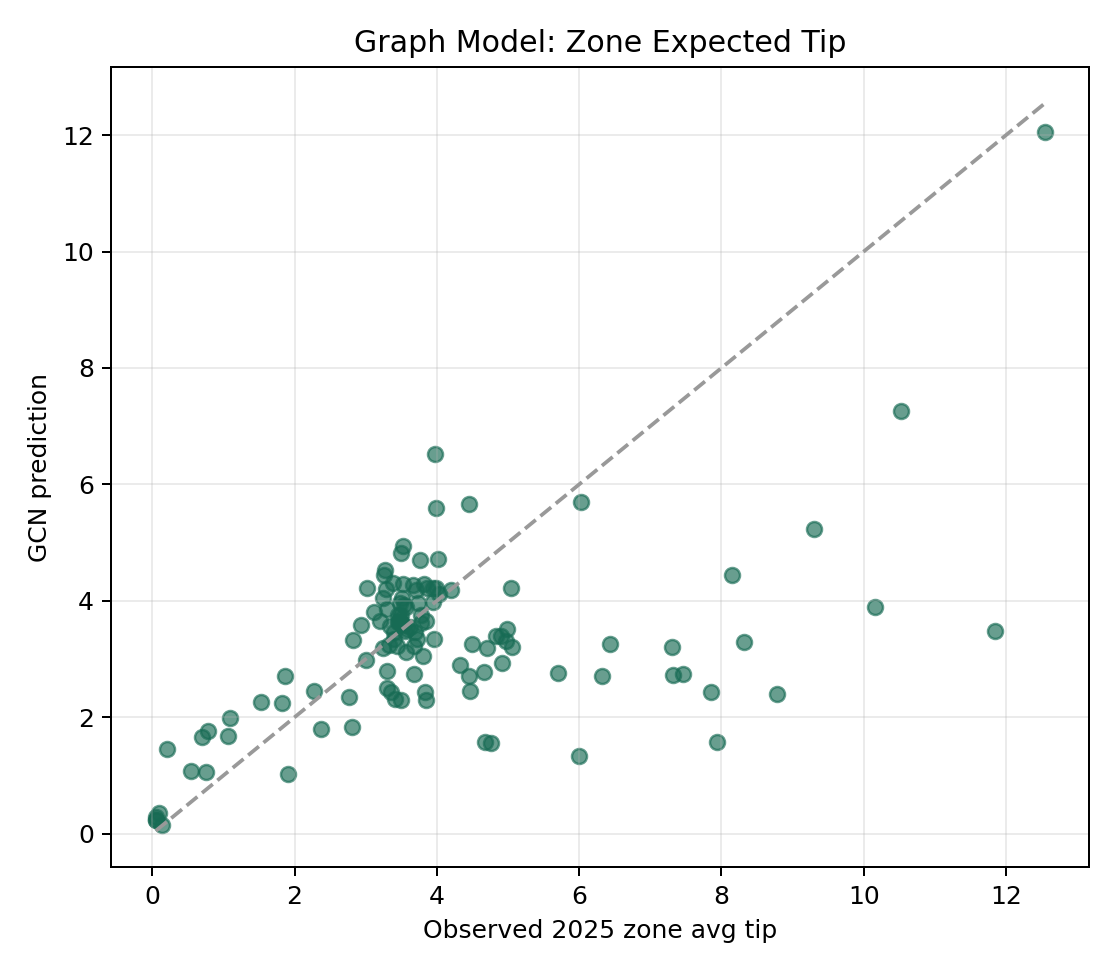
This is the result we obtained. It indicates that GCN performs fairly within the expected tip range of 3 to 5, but its performance is very poor in the extremely low or high expected tip space. This indicates that the regional characteristic differences in New York are extremely intense. However, GCN often likes to fit extreme values to the average value, which leads to the situation shown in the figure where high-TIPS regions have low predictions and low-TIPS regions have high predictions. We thus gave up using the GCN model.
LSTM
Because the data has time series characteristics, we attempt to use LSTM to capture the time series signals within the past hour in order to predict future returns. We have envisioned such a scenario: if a driver has encountered passengers giving high tips one after another in the past few hours, or is currently in a peak period of tips, then the LSTM should be able to capture this trend of tip changes at the temporal level and thus predict the subsequent earnings more accurately.
We have obtained the following two pictures:
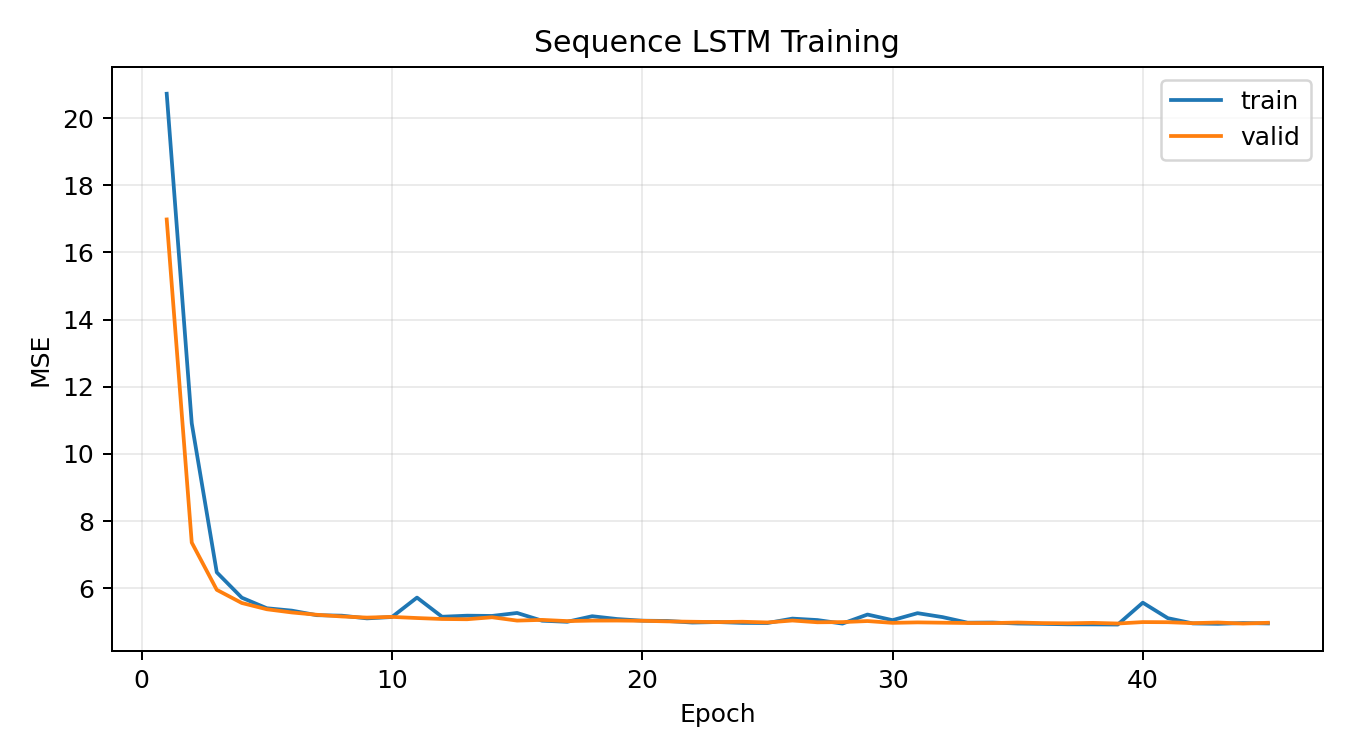
From this graph, we can find that LSTM converges rapidly in the first few epochs, and then the training error and validation error remain around 5 and are very close. This indicates that the model has a good generalization ability. However, MSE had already reached its fitting capability limit of around 10 epochs and could no longer further reduce the error. This indicates that although LSTM is effective, the positive impact it brings is also very limited.
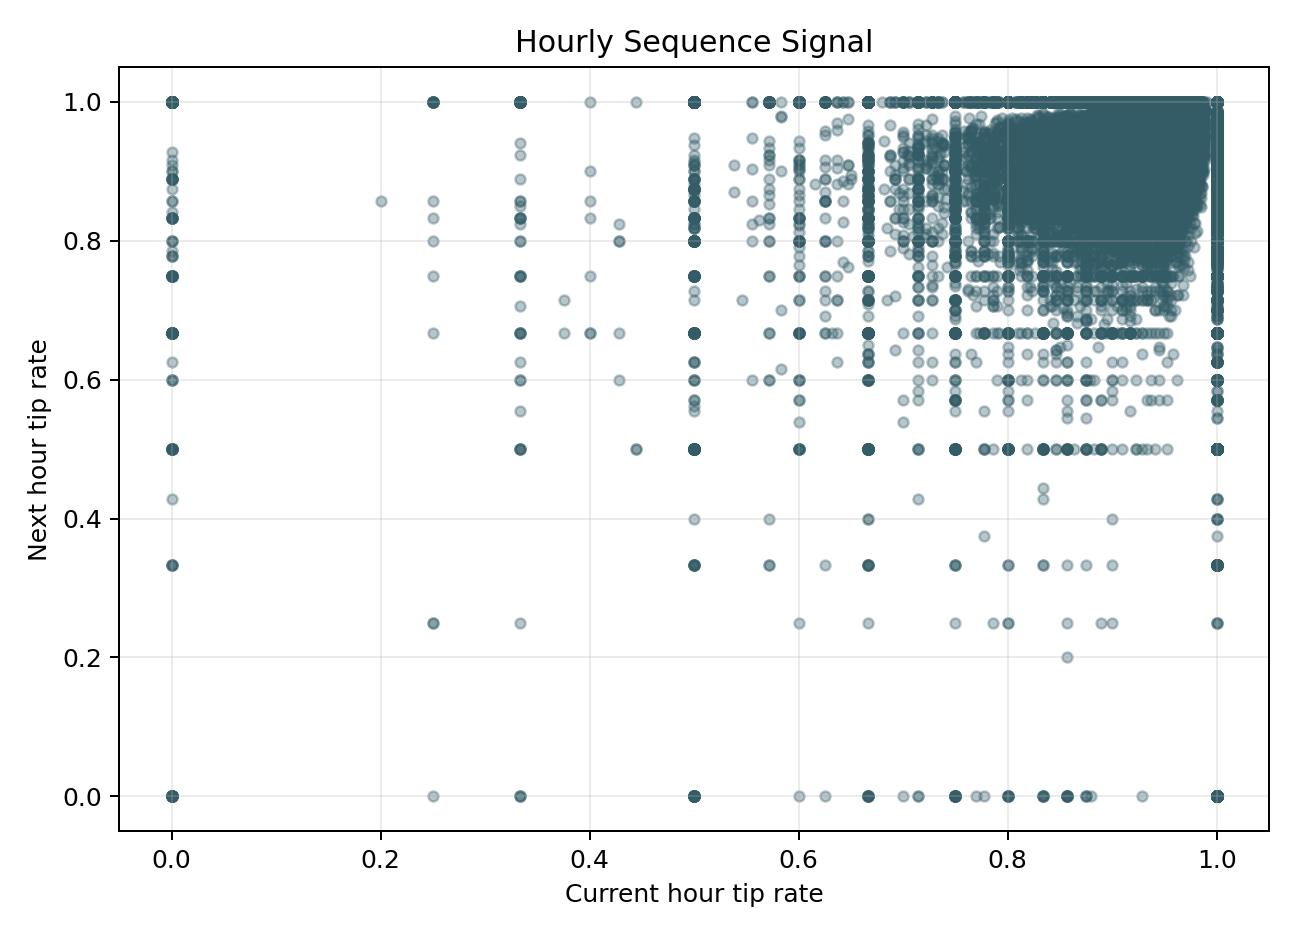
From this diagram, we find that when we break down time to the hourly level, there is actually no clear relationship between hours. The time series features in the dataset are random. For LSTM, if the data from the previous time step and the next time step do not have a strong causal or trend connection, its performance will be very poor. Overall, we found that the small rates fluctuated very little within a single hour and lacked a clear sequential progression relationship, so we were unable to use LSTM.
Driver Copilot Evaluation
Our ultimate goal is to deliver a product that is truly useful to drivers. Therefore, we conducted a comprehensive assessment of the Driver Copilot that integrates the above-mentioned model.
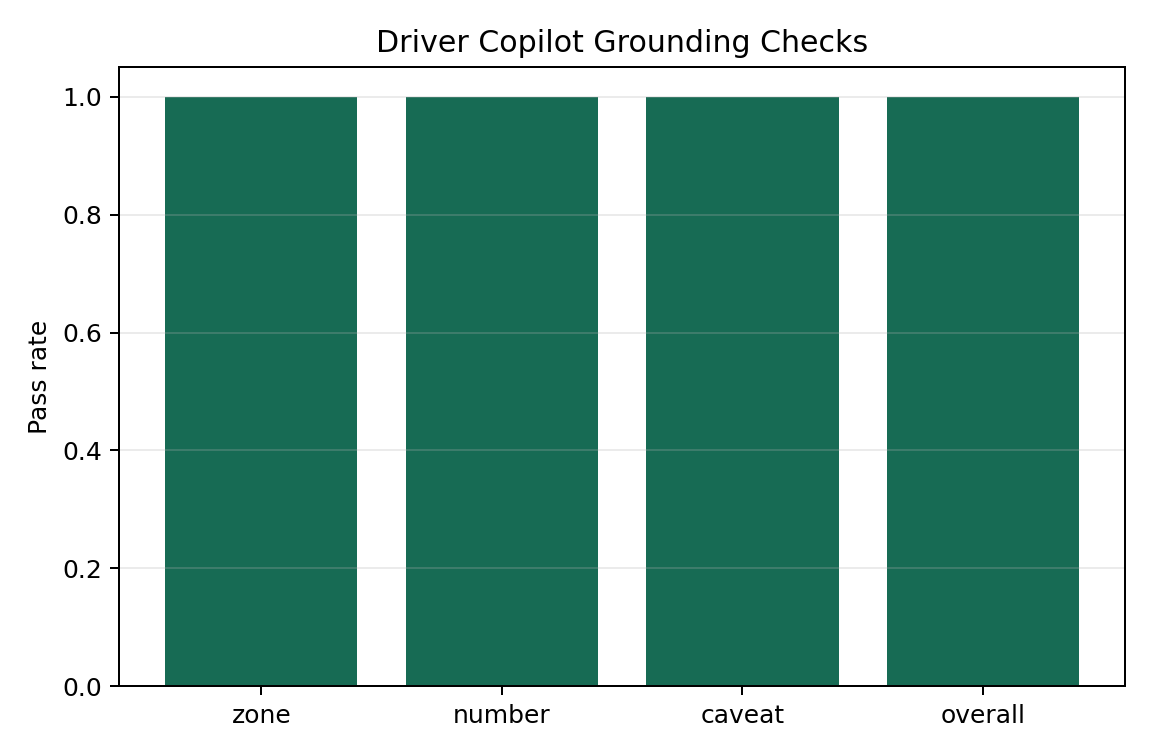
The evaluation shows that the AI Copilot, which combines the precise point prediction of the tree model and the uncertainty interval of the MDN, has passed the grounding check at the zone, number, caveat and overall levels. This indicates that our AI Copilot can correctly utilize regional information and tip numerical information to accurately express uncertainties and constraints.
Map
At the end of the project, we created a map to help users intuitively understand the real situation of tips in various areas of New York
Conclusion
The Tip or Skip project restructured the prediction of New York taxi tips into a two-stage, classification and regression problem. It also possesses the ability to perceive uncertainty. Our core output is an app in the Hugging Face space, which includes all the experimental charts and data mentioned above, as well as the most important Driver Copilot and the map of tips in New York City. Looking back on the entire project, our greatest success was not merely running through all the baselines and deep models. What was more important was that we built a truly user-centered app experience. Through the content of this app, we can achieve precise prediction of tips and provide corresponding services/ride suggestions for drivers or passengers. For example, providing personalized shift scheduling suggestions, pick-up preference optimization, and area selection guidance for drivers. Providing better ride suggestions for passengers, such as recommending choosing other transportation methods in high tip areas. This represents a progress from data analysis to application implementation. Regarding the selection of models, our conclusion is that gradient boosting trees are the best point prediction tool, while Transformer MDN provides crucial uncertainty assessment for actual shift scheduling and decision-making. Our Driver Copilot was also trained by combining these two models. It must be emphasized that what we emphasize is the patterns summarized from data, rather than causality. This means that the model cannot give 100% accurate suggestions. For example, as long as the driver shifts to a high-rated area to pick up passengers, they will definitely receive higher tips. Therefore, users should use our project as an auxiliary tool.
Ethics & Bias
Our project may have both positive and negative impacts on society. Let's first analyze the potential negative effects. At the beginning of this project, we did not consider the moral and social impact aspects. However, as the project progressed, we gradually realized that morality and biases might be implicitly present in our project. First, our project is biased towards data summarization and prediction. Therefore, our model is very likely to incorporate the biases hidden in the data, such as the consumption levels in certain regions might be linked to local residents' income, race, and various social issues. If our project is applied to drivers' decisions (such as the areas they pick up passengers from and the business hours), it might cause drivers to deliberately avoid low-income areas. This could inadvertently exacerbate economic or social inequality. Secondly, regarding the positive impacts, I believe it is an important data foundation for sociologists and the social level to discuss the rationality of tips. The tip culture itself has a lot of controversy, especially in cities like New York where consumption is particularly high. Many people believe that tips should be regarded as a reward for the service provided by the service providers rather than an invisible burden for passengers. Our project can provide a powerful data basis for the discussion of this issue. Our project can visually demonstrate the real distribution of tips in different regions, different times, and different prices. This project will not directly say whether the existence of tips is good or bad, but use data to support public discussions, allowing policymakers and the public to have more evidence when making
AI in the project
First of all, we need to distinguish the difference between using AI and not using AI. In generally speaking, when we say not to use AI, we mean to use traditional statistical methods to help us solve problems. For example, linear regression and traditional regression types. Machine learning methods. The use of AI refers to the application of AI-related models. For example, deep learning models like transformer. For our project, from a macro perspective, our project is to analyze whether passengers will leave tips and the specific number of tips. These are two decision-making processes and are influenced by multiple behavioral patterns. It is very difficult to capture such complex relationships and patterns if only simple linear models or traditional statistical methods are used. Specifically, our dataset contains 64 dimensions and millions of time-series data records. Such high-dimensional and non-linear data cannot be modeled using traditional methods. So, we need to use AI methods to provide us with a good model. Secondly, one of the key focuses of our project is uncertainty analysis, and we have adopted the structure of MDN to achieve this. Finally, the Driver Copilot in the project is directly dependent on AI. Without AI, the core functions of the project would be missing, and we might not even be able to complete these functions. They are reflected in high-precision predictions, data analysis and the presentation of the final results.
Prospective works
There are many things we can do. In general, there are three directions: we can enhance the model, develop an application for users, and broaden the research topic. First, regarding the model enhancement, we now know that the Transformer model is not the best for point prediction; the tree model is already the optimal one. If we have more time, we will not continue to research better deep learning models but rather enhance the existing models. For example, we can conduct robustness tests on the existing models and provide the model with different factors such as time, location, weather, and types of taxis to see if the model can perform stably on these different data. Based on this, we can conduct outlier checks on these dimensional subgroups and identify abnormal values (such as abnormal yellow vehicle consumption data in a specific month under specific weather conditions). In this way, we can detect problems in the model or summarize new patterns earlier. In addition, we can input new data (such as data from May 2026) into the model training and create an automated monitoring script to monitor the feature distribution of the latest data. If there is a drift in the distribution, we can detect it in time. For the APP part, we can turn the existing Driver Copilot into a practical application, allowing drivers to quickly know their current tip expectation without having read our project report. Drivers can make decisions on which areas to go to and at what time based on the app's prompts. We can use a simpler interface to summarize complex charts into a sentence containing the region name, vehicle type, and expected tip, rather than a lengthy explanation. At the same time, we can launch some manual calibration functions. If the driver actually receives a lower tip than expected, he can provide feedback. After receiving this feedback, we can improve our model. Finally, we can broaden our research topic. For example, we can expand the research on cities to other major cities besides New York, such as Chicago, Boston, London, Beijing, etc. We can also broaden our research on vehicle types. We can not only predict the tip for taxis but also conduct tip research for ride-hailing or other passing vehicles.